An hyperbola is the set of all points whose distances to two fixed points subtract to the same constant. In this section, we will focus on the equation of hyperbolas.
The axis that contains the vertices is called the transverse axis and the axis that does not contain the vertices is called the conjugate axis. Also notice that the shape is very different than that of a parabola, hyperbolas are asymptotic to the following lines:
We will make use of these asymptotes to sketch the graphs of hyperbolas.
To easily graph the asymptotes of a hyperbola use the following process.
Step 1: Identify the center (h, k) from standard form. Step 2: Plot points a units left and right from center. Step 3: Plot points b units up and down from center. Step 4: Draw the rectangle defined by these points. Step 5: The lines though the corners of this rectangle are the asymptotes!
Finally use the equation to determine if the parabola is vertical or horizontal.
We knew to draw the above hyperbola opening to the left and right because the x^2 term was positive. If the x^2 term is negative then the hyperbola opens up and down.
Compare this hyperbola to the previous and note the difference in standard form. The rectangle and asymptotes are not actually part of the graph. We use these to obtain a more accurate sketch. When graphed on a graphing utility the result looks like this.
Graph the hyperbola and give the equations of the asymptotes.
The next examples require us to complete the square to obtain standard form. Remember to factor the leading coefficient out of each variable grouping before using (B/2)^2 to complete the square.
Graph the hyperbola, x- and y- intercepts, and give the equations of the asymptotes.
When we completed the square, notice that we added 64 and subtracted 225 to balance the equation. It may appear, at first glance, that we added 16 and 25 to the left side. But in reality, after we distribute the 4 and -9 we added and subtracted larger values.
When the transverse axis is vertical be careful with the center. A common error is to use (-2, 1) for the center in the above example because the y variable comes first and we are used to reading these from left to right. This would be incorrect so take care to use the correct h and k.
Example: Find the equation of the hyperbola centered at (-3, 1) where a = 2, b = 3, and with a vertical transverse axis. Graph it.
Example: Find the equation of the hyperbola with vertices (3,0) and (-3,0), horizontal transverse axis, and conjugate axis of length 4 units.
Example: Find the equation of the hyperbola with center (2, -5), vertical transverse axis measuring 10 units, and conjugate axis measuring 6 units.
YouTube Videos: Click problem to see it worked out.
An ellipse is the set of all points whose distances to two fixed points add to the same constant. In this section, we will focus on the equation of ellipses.
The long axis of an ellipse is called the major axis and the short axis is called the minor axis. These axes terminate at points that we will call vertices. The vertices along the horizontal axis will be (h ± a,k) and the vertices along the vertical axes will be (h, k ± b). These points, along with the center, will provide us with a method to sketch an ellipse given standard form.
Given the equation of an ellipse in standard form we can graph it using the following steps:
First plot the center (h, k).
Plot a point a units up and down from the center.
Plot a point b units left and right of the center.
Sketch the ellipse and label the four points.
In this example the major axis is the vertical axis and the minor axis is the horizontal axis. The major axis measures 2b = 10 units in length and the minor axis measures 2a = 6 units in length. There are no x- and y- intercepts in this example.
Graph the ellipse. Label the center and 4 other points.
It will often be the case that the ellipse is not given in standard form. In this case, we will begin by rewriting it in standard form.
Graph the ellipse. Label the center and four other points.
The next set of examples give the equations in general form. Complete the squares to obtain standard form. Remember to factor the leading coefficient out of each variable grouping before using (B/2)^2 to complete the square.
Graph the ellipse. Label the center and four other points.
Answer the questions.
When the calculation for intercepts yields complex results then there are no real intercepts. This just means that the graph does not cross that particular axis.
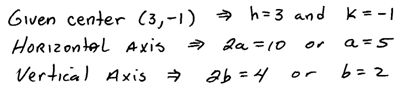
Example: Find the equation of the ellipse centered at (3, -1) with a horizontal major axis of length 10 units and vertical minor axis of length 4 units.
Example: Find the equation of the ellipse given the vertices ( ±3,0) and (0, ±8).
Example: Find the equation of the ellipse whose major axis has vertices (-1, -2) and (-1, 10) and minor axis has co-vertices (-3, 4) and (1, 4).